
Media and pundits
Data and narratives for content
Turn matches into content. Branded graphics and model-led storylines, ready to publish.
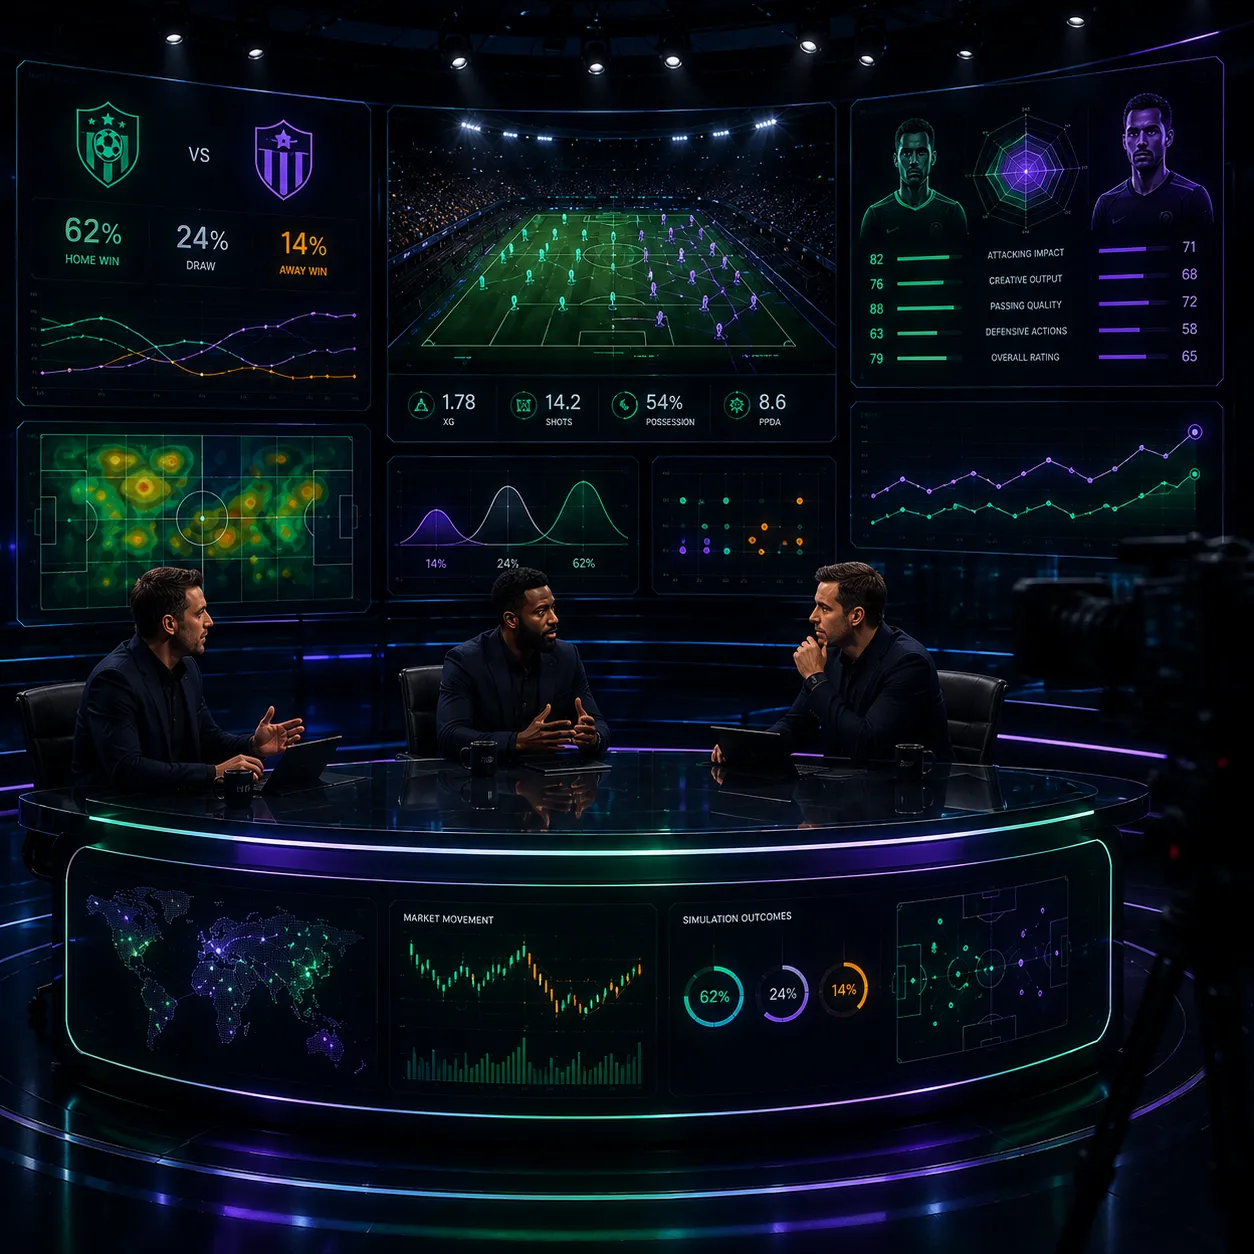
Where it hurts
- Slow production of match graphics
- Generic takes with no data
- No house style for visuals
How Lemeister maps to you
- Branded, code-rendered graphics
- Model-vs-market storylines
- A consistent visual identity, stamped
What you actually get
A graphic package built from live model and market data, ready for the house style.
Inside the graphic package
headlinemodel: 54% home win · market implies: 47%
graphic typemodel-vs-market comparison card
brandhouse style, auto-rendered
export formatsPNG 1080×1350, MP4 9:16
Illustrative — real graphics render from live model and odds data ahead of each fixture
What a newsroom typically uses this for
Pulling a pre-rendered, on-brand model-vs-market graphic for a matchday preview instead of building one from scratch, or leading a segment with a storyline the data actually supports.